AI, machine learning and deep learning: understanding the differences

Artificial intelligence (AI) is the broader field. Machine learning learns from data; deep learning is a family of these methods. Generative AI refers to producing content, such as text or images. To understand the differences, we will follow one problem throughout: estimating an exam score from information available before that score is known.
We will start with what the software needs to do, then see how it learns and how to check its answer. You will then be able to place deep learning within this framework and understand the role of a generative assistant in an application. No code is needed for this first lesson.
Contents
1. AI and machine learning: start with a concrete problem
Artificial intelligence includes approaches that enable systems to perform tasks such as recognition, reasoning, prediction or content creation. The OECD explains how an AI system operates : given inputs and objectives, it infers how to produce outputs such as predictions or recommendations. AI can rely on knowledge organised by people or on learning from data.
In our example, we know the study hours, class attendance rate and previous scores. We want to estimate the final score before it is known. Here, estimating means providing an approximate value: the software cannot know the result with certainty.
A rule is written; a model is learned
If you ask, “Flag rows where attendance is below 80%,” you have already supplied the criterion. The software applies an explicit rule. In the first two rows of the file, attendance is 84% and then 64%: only the second row is flagged. The 80% threshold is chosen for this example.
When estimating a score, the relationship is less obvious. How should study hours, attendance and previous scores be combined? Machine learning builds a relationship from examples. This relationship is represented by a model: a mathematical representation that transforms input information into an answer. See Google’s introduction to machine learning.
A person chooses the problem, the data and the method. The learning procedure adjusts the model using the examples. We will explain this adjustment in section 3; for now, remember that the relationship used to estimate the score comes from the data.
Figure 1 compares where the logic comes from in these two approaches. Their objectives differ: flagging low attendance and estimating a score are not interchangeable answers to the same problem.
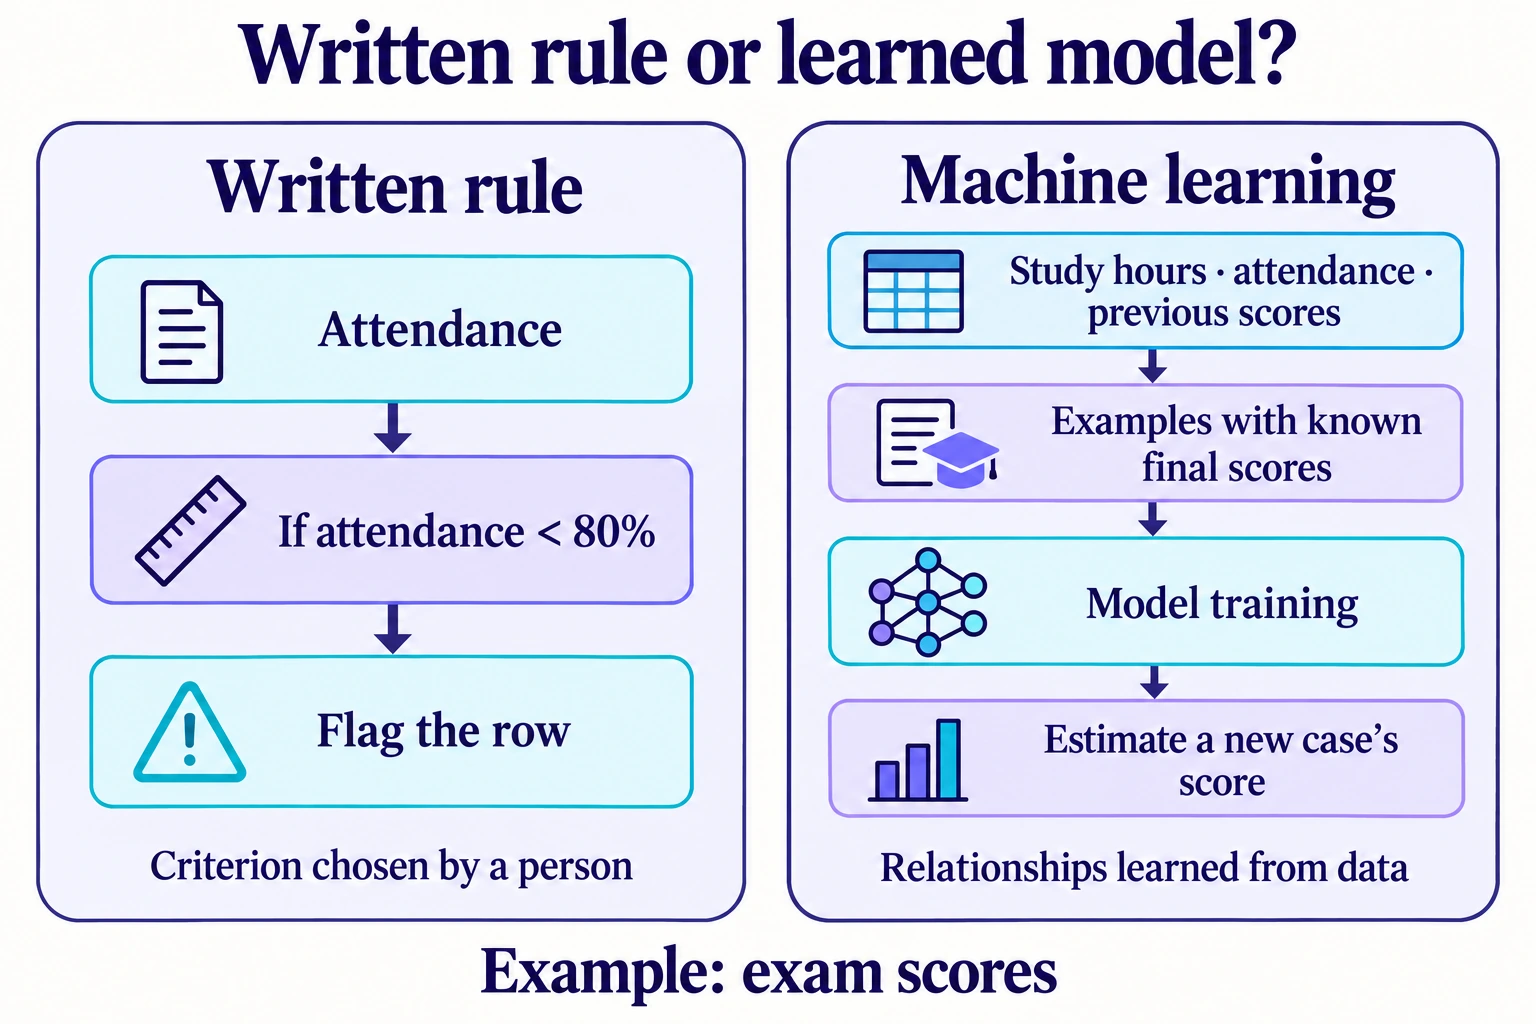
An application can combine both: a rule checks that the entered percentage is between 0 and 100, then the model uses the valid information to estimate the score. An automated calculation, such as a column average, is therefore not enough to characterise an AI system.
2. Regression or classification: specify the answer you need
Before learning a relationship, we need to specify what the model receives and what it should produce. An input variable is a piece of information supplied to the model. The target is what we want to predict. In our first example, the three inputs are study hours, attendance and previous scores; the target is the final score.
| Column and meaning | Known value | Role |
|---|---|---|
Hours_StudiedStudy hours per week | 23 hours | Input |
AttendancePercentage of classes attended | 84% | Input |
Previous_ScoresScores on previous exams | 73 points | Input |
Exam_ScoreFinal exam score | 67 points | Target |
The 67 points are a value recorded in the file. During training, this known answer lets us check what the model estimates. When using the model in a new situation, we will provide only the inputs: the final score will be the answer we are seeking. If you would like to consult the source of these examples, the course workbook is available.
Estimating a score: regression
Regression estimates a numerical quantity. Our question is, “What final score can we predict?” The expected answer is a score in points. To judge its quality, we will compare estimated scores with scores actually recorded in examples set aside for evaluation.
Predicting a category: classification
Classification predicts membership of a predefined category. In our classification dataset, the target is Result, already filled with Success or Fail. The model learns to predict that category from the inputs. This dataset is separate from the regression dataset, whose target is a numerical score.
Here are two observations from the classification dataset. The first has 23 study hours, 84 % attendance and a previous score of 73; its Result is already filled with Success. Another has input values of 13, 69 % and 68; its Result contains Fail. The model learns to predict these supplied labels from the three inputs.
Figure 2 compares two separate tasks: estimating a score in regression and predicting the category Result in classification. The Success and Fail labels are already present in the training examples. They are unknown for new cases, so the target must stay out of the model’s inputs.
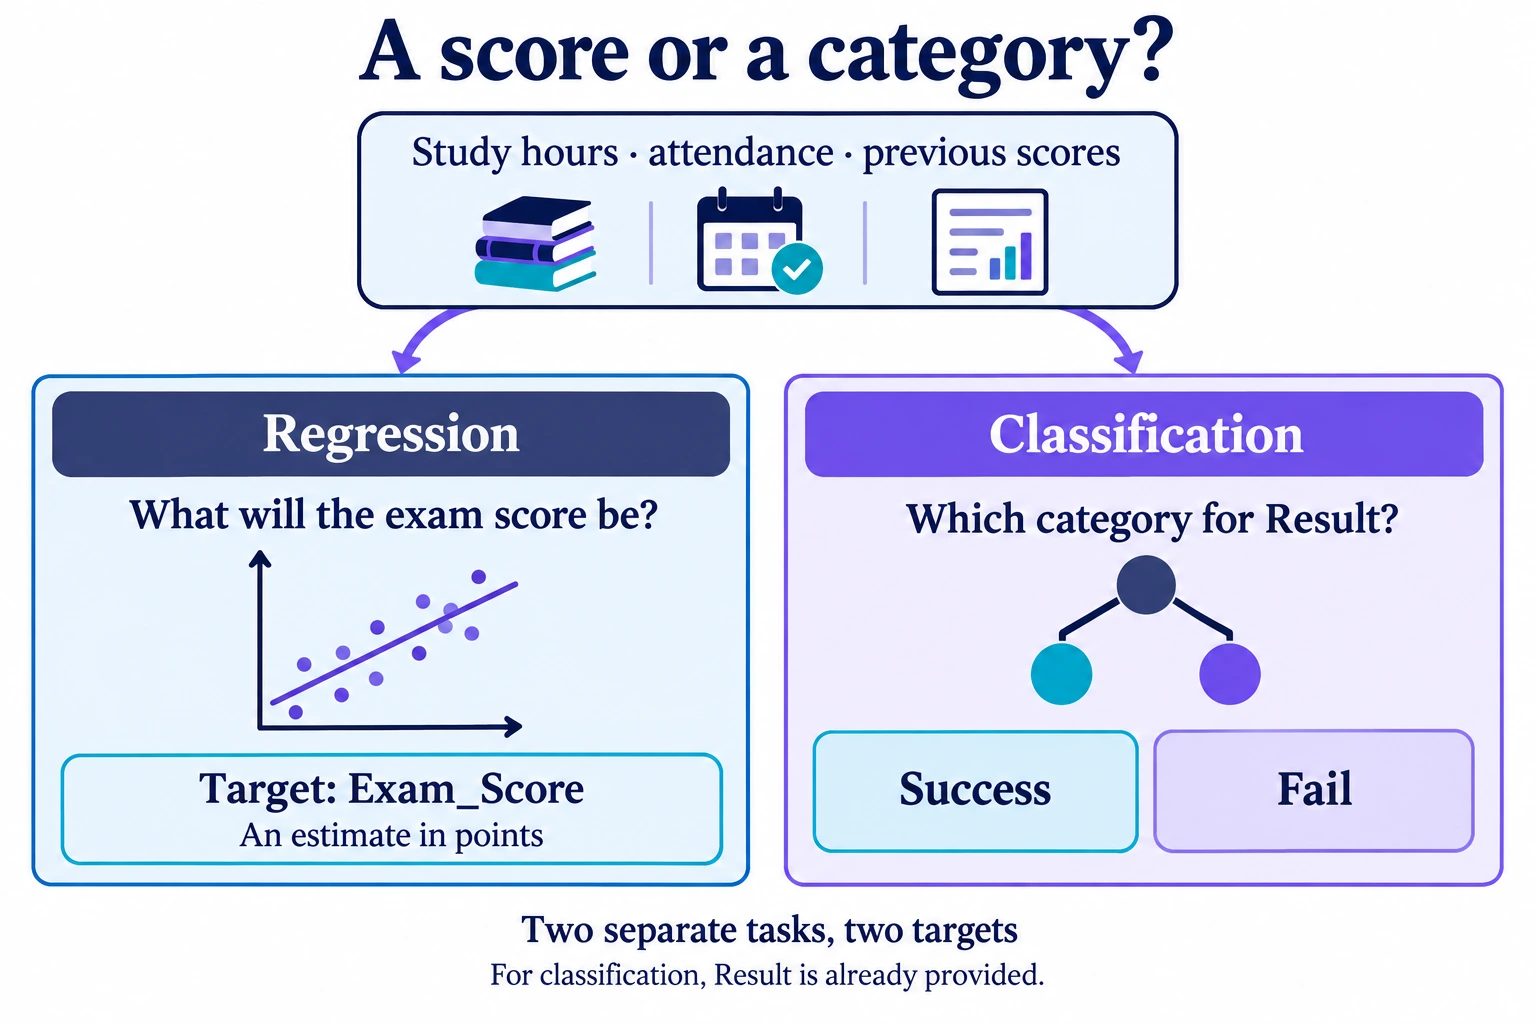
Classification with two categories is called binary classification. A model can also estimate a probability before assigning a category; we will return to this distinction in the further explanations. For the rest of the lesson, let us keep our first objective: estimating a score.
3. How a model learns and is then used
Our examples contain the inputs and the known answer. This is supervised learning : the answer serves as a reference during training. “Supervised” describes the available examples; “regression” describes the answer we want to produce. The same model can perform regression through supervised learning.
Training: adjusting the relationship using examples
Imagine a model that combines our three inputs using coefficients. These coefficients are parameters : values that determine how the model calculates its answer. Training means adjusting them using the examples and their known final scores.
The procedure calculates estimates, compares them with known answers, then changes the parameters to reduce a measure of the discrepancies. This measure is called a loss function. A learning algorithm is the computational procedure that organises this adjustment; the trained model is the resulting model. Google’s glossary explains these terms.
With linear regression, the answer is built from a weighted sum of the inputs plus a constant. “Weighted” means that each input is multiplied by a coefficient. With one input, this relationship is a straight line; with several inputs, it combines their contributions. This method is one possibility, not the definition of all regression. See the introduction to linear regression.
Evaluation: checking examples that were not used for training
Reproducing scores from the training examples is not enough. We set aside other rows, with their answers, to measure the model’s errors. We provide their inputs, then compare its estimates with the known scores. This is evaluation.
We want the model to generalise : to provide useful estimates for situations absent from training. If the model adapts too closely to the details of its examples and performs poorly on other cases, this is overfitting. Google’s lesson on generalisation examines this difficulty in more detail.
We also need a comparison point. A simple baseline could always predict the median score of the training examples. The median is the value dividing their ordered scores into two halves. A more elaborate model should provide a measured improvement over this baseline on the same evaluation cases.
Prediction: applying the trained model to a new case
We can then provide study hours, attendance and previous scores for a case whose final score is unknown. The model uses its learned parameters to produce an estimate. This is prediction, also called inference.
In this context, “predicting” means estimating an unknown answer; it does not necessarily refer to a future event. This use does not automatically trigger further training. An application can process many requests using the same trained model.
Inputs and known scores: adjust the model.
Held-out examples: measure errors.
New inputs: estimate an unknown score.
An estimate remains uncertain, even after a satisfactory evaluation. An association between study hours and the final score also does not prove that adding an hour of study would cause a particular increase. Predicting a value and establishing a cause are two different objectives.
4. Deep learning: a family of machine learning methods
We have defined the task and the three stages of the model’s life. We can now choose a method. Deep learning uses neural networks with several processing layers. It is part of machine learning: its parameters are also learned from data.
An artificial neural network is a model made up of interconnected computational units. A layer groups units that transform received values and pass their results to the next layer. The network’s parameters, often called weights, determine these transformations. Here, “neuron” refers to a mathematical unit, not a biological neuron.
To estimate our score, the input values pass through several successive transformations before reaching the output. The intermediate layers learn numerical combinations useful for the task. These ways of encoding information are called learned representations. They do not necessarily correspond to human concepts such as “effort” or “motivation.” This principle is explained by LeCun, Bengio and Hinton (2015) and in Google’s course on neural networks.
The task remains regression if the output is a score. Replacing linear regression with a deep network changes the method, not the question. Similarly, a deep network can perform classification if it predicts a category.
Deep learning is also used to process images, text and sound. For our table, its complexity does not guarantee better estimates: we will need to compare methods on the same held-out examples, then consider errors, speed and resource requirements.
5. Generative AI: producing content
Generative AI produces content from patterns learned in data. It can generate text, images or sound. The term describes what the system produces; it does not refer to one single method. Major current generative models rely in particular on deep learning.
Let us change the need: we want to explain the columns to the person using the application. We can provide the field descriptions and an instruction: “Explain the difference between study hours and attendance rate.” This instruction is often called a prompt.
A large language model, or LLM, is a model trained on large amounts of text to process and produce language. It could write the explanation from the definitions provided. We would be using an already trained model; we would not train a large language model on our 6,607 rows.
| Function | Input | Expected output |
|---|---|---|
| Estimate the score | Study hours, attendance, previous scores | A score in points: regression |
| Explain the fields | Column descriptions and an instruction | Text: generation |
A well-written answer can contain a false statement or an invented source. This is often called a hallucination. We therefore need to check the text against the original document. If the assistant explains an estimated score, it must not attribute causes that the model has not established. See the introduction to language models.
Placing the four concepts after the examples
Figure 3 brings together the terms we have encountered. Machine learning is part of AI; deep learning is part of machine learning. Generative AI describes a content-producing capability: some deep models are generative, and other generative models exist without a deep network.
The field: recognising, reasoning, planning, producing…
An approach: learning relationships from examples (data).
A family of models: neural networks with multiple layers.
Creating text, images, sound… This is where generative large language models and common diffusion models belong.
Deep learning also has non-generative uses, such as estimating a score from a table.
Models can also learn to generate examples without using a deep neural network.
A deep network that estimates a score is therefore a deep learning model performing regression. A generative large language model is a deep learning model producing text. “Deep learning” and “generative” answer two different questions: which method is used, and what output is produced?
6. From a model to a web application
The model is one component of the application. Figure 4 shows the workflow: the sequence of work required to turn a need into a usable tool. The training and evaluation we explained occupy two stages within this broader process.
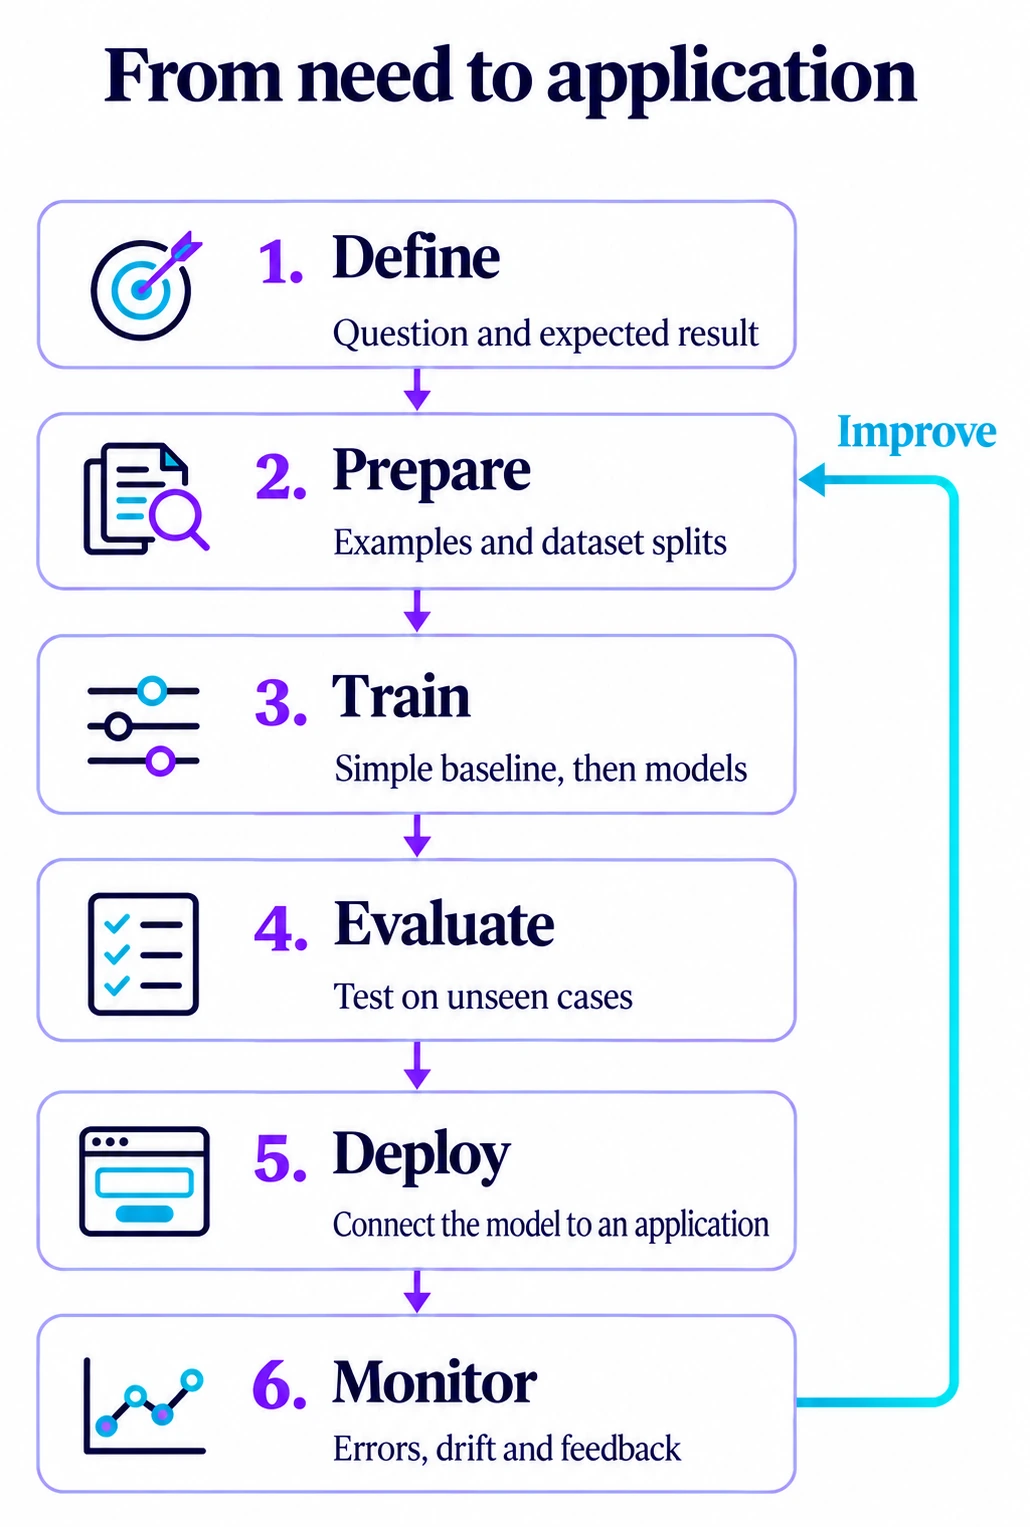
- Define. Specify the desired output, the information known when a request is made and the acceptable errors. Here: an estimated score from three inputs.
- Prepare. Check definitions, units and data quality. Split the examples before fitting transformations and the model.
- Train. Build a simple baseline, then learn the parameters of the models to be compared.
- Evaluate. Measure errors on held-out cases. Also examine large discrepancies and situations that are less well represented.
- Deploy. Make the model available to the application, together with the transformations needed to prepare its inputs.
- Monitor. Check operation and, when actual scores become available, how errors change over time. A change in population or context can make earlier relationships less relevant: this is a form of drift.
Once the model is available, each request follows a shorter route: the user enters information, the application checks it, the model estimates the score and the screen displays the result. This route uses the model; it does not repeat the six project stages with every click.
Enter study hours, attendance and previous scores.
Check and prepare the values, then apply the model.
Present the estimated score and its limitations.
The interface can communicate with a service through an API, an interface for exchanging information between software systems. The application also needs to handle invalid inputs, delays and outages. Google’s documentation on machine learning systems in production describes the work surrounding the model.
Our course application will help us understand this process. The workbook alone does not validate its use for decisions about people. If we add a generative assistant, we will also need to check that its explanations faithfully reflect the supplied documents.
7. Check your understanding
Answer in your own words first, then open the explanation. These five situations revisit the distinctions you will need for the rest of the course.
1. Flagging attendance below 80%: do we need to train a model?
A rule is enough: the criterion is already known. It will flag, for example, the 64% attendance in the second row. It does not predict the final score. Learning becomes a different approach when we want to estimate that score from examples.
2. Are the 67 points in the first row a prediction?
No: this is the known score in the file. It serves as a reference answer during training or evaluation, depending on which dataset contains the row. A prediction would be a value calculated by a model; no model result is presented here.
3. A deep network learns from known scores and estimates a score: how should we describe this work?
The task is regression, because the output is a quantity. Learning is supervised, because the examples contain the answers. The method belongs to deep learning, because it uses a deep network. These descriptions complement each other; there is no need to choose just one.
4. The model reproduces the training scores: does that prove it is reliable?
No. We need to measure errors on held-out cases, check that the answer is not hidden in the inputs and compare results with a simple baseline. We then need to test the application’s request flow, particularly data entry and display.
5. The assistant writes an explanation of the columns: is it also estimating the score?
Writing this explanation is text generation. Estimating the score is another function, which we would assign to an evaluated regression model. The text should remain faithful to the descriptions and should not invent causes for the results.
8. Key points and the next step
To understand a system, start with its question, inputs and output. You can then describe the task, the learning approach and the method used.
- AI: the broader field. Machine learning: learning a relationship from data.
- Regression: estimating a quantity. Classification: predicting a category. Supervised learning: learning from known answers.
- Deep learning: a family of machine learning methods. Generative AI: producing content, often using these methods.
- Train, evaluate, predict: adjust the model, measure its errors on held-out cases, then apply it to a new situation.
9. Further explanations and resources
You have completed the foundations of this lesson. The following explanations address more specific questions; you can return to them when these concepts become useful.
Why distinguish training, validation and testing?
Training adjusts the parameters. Validation lets us compare settings or models during development. Testing is used for the final evaluation after choices have been fixed. Repeatedly using test results to choose the model would undermine this dataset’s role as an independent evaluation. Transformations learned from data must also be fitted without using test answers. See training, validation and test sets.
Classification: why might we obtain a probability?
A model can estimate the probability of the Success category and then apply a decision threshold. This threshold applies to a probability; the categories in Result are already provided in the training data. The model does not create these labels. Calibration means checking whether reported probabilities match observed frequencies across many cases. A numerical output therefore does not automatically make a task regression. See classification thresholds and Calibration.
What other tasks and learning approaches exist?
Clustering looks for similarities without receiving categories to predict. We could group rows by study hours, attendance and sleep. This is an example of unsupervised learning: looking for structure without supplied target answers. These groups then need to be interpreted. See the clustering documentation.
Anomaly detection identifies the unusual. The value 101 in Exam_Score, which appears in the file, calls for checking the scale and the source; it should not be deleted automatically. A rule may be enough to flag it, while a model can look for unusual combinations. See Anomaly detection.
Recommendation suggests items considered relevant. Recommending a study resource would require information on resources and their use, which this table does not contain. Reinforcement learning learns an action strategy from feedback and rewards. The number of tutoring sessions does not describe a sequence of actions and feedback: the workbook alone cannot support that demonstration. These concepts address different questions; reinforcement learning is a learning approach. See the learning approaches.
What does a study-hours and scores chart show?
Figure 5 shows the workbook’s first 100 rows. Each turquoise point pairs study hours with a known score.
How should we read the red line? It is a linear regression line: for a given number of hours, its height indicates the score estimated by a model using study hours alone. It is fitted to the 100 displayed points by minimising the sum of squared vertical differences between observed scores and the line, using the least-squares method described by NIST.
Its slight upward slope summarises the trend in this excerpt. Points above or below it show that actual scores differ from the estimate. This relationship does not prove that studying more causes a score to increase; the model’s reliability on new cases still needs to be evaluated.
How does a language model produce text?
It processes text in units called tokens : words, word fragments or characters, depending on the system. A common mechanism is learning to predict the next token from the preceding text. The training answer is then obtained from the text itself: this is self-supervised learning. During generation, the model progressively produces a sequence of tokens. These mechanisms explain some of its capabilities without guaranteeing the truth of the resulting text. See the course on large language models.
Recent uses to explore after the foundations
Multimodality, RAG, agents and local models: a snapshot as of 8 October 2026
Multimodality. A model processes several types of information, such as text and an image. An interface could accept a screenshot of the table and a question about a column. Reliable calculations should still use the actual cells. The Gemma documentation describes capabilities that vary between models.
RAG. Retrieval-augmented generation finds passages in documents and supplies them to the model to help prepare an answer. An assistant could retrieve a column’s definition from the workbook’s data dictionary. This adds context without necessarily retraining the model and does not eliminate all errors. See Google Cloud’s explanation.
Agents. An assistant can choose steps and use tools to pursue an objective, such as looking up a definition and then asking a calculation tool to count empty cells. Results and access permissions need to be checked. This behaviour alone is not a demonstration of reinforcement learning. See the distinction between workflows and agents by Anthropic.
Local models. Some model sizes can run on a compatible computer. Such a model could explain column descriptions. Memory requirements and capabilities vary; other application components may still transmit data. See the Gemma specifications.
Sources and suggested reading order
- To strengthen the foundations: introduction to machine learning, followed by the relevant chapters of Google’s Machine Learning Crash Course. The glossary helps you look up a term when you need it.
- To organise a project: framing the problem and managing a machine learning project.
- For reference definitions: OECD (2024), Explanatory memorandum on the updated OECD definition of an AI system, OECD Artificial Intelligence Papers, no. 8, DOI: 10.1787/623da898-en; LeCun, Y., Bengio, Y. and Hinton, G. (2015), Deep learning, Nature, 521, pp. 436–444, DOI: 10.1038/nature14539.
- For the data used in this lesson: Student Performance Factors — Lai Ng., Kaggle. The values shown were checked in the “Données” and “Description des champs” worksheets of StudentPerformanceFactors.xlsx on 8 October 2026.
