Regression, classification or clustering: which task should you choose?
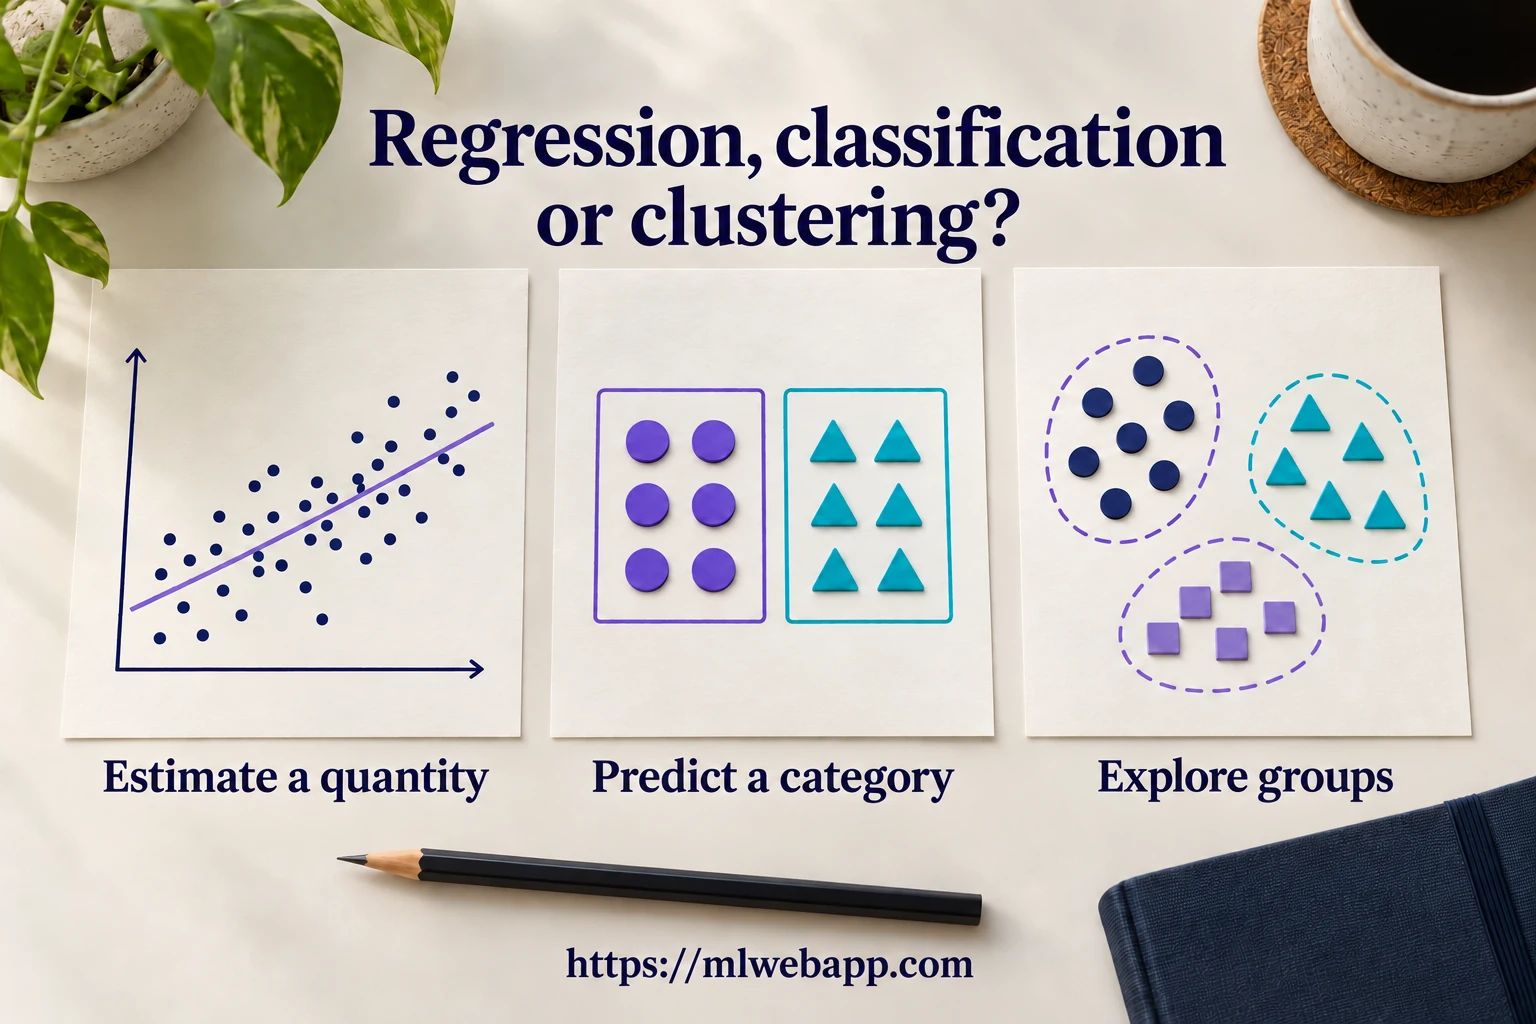
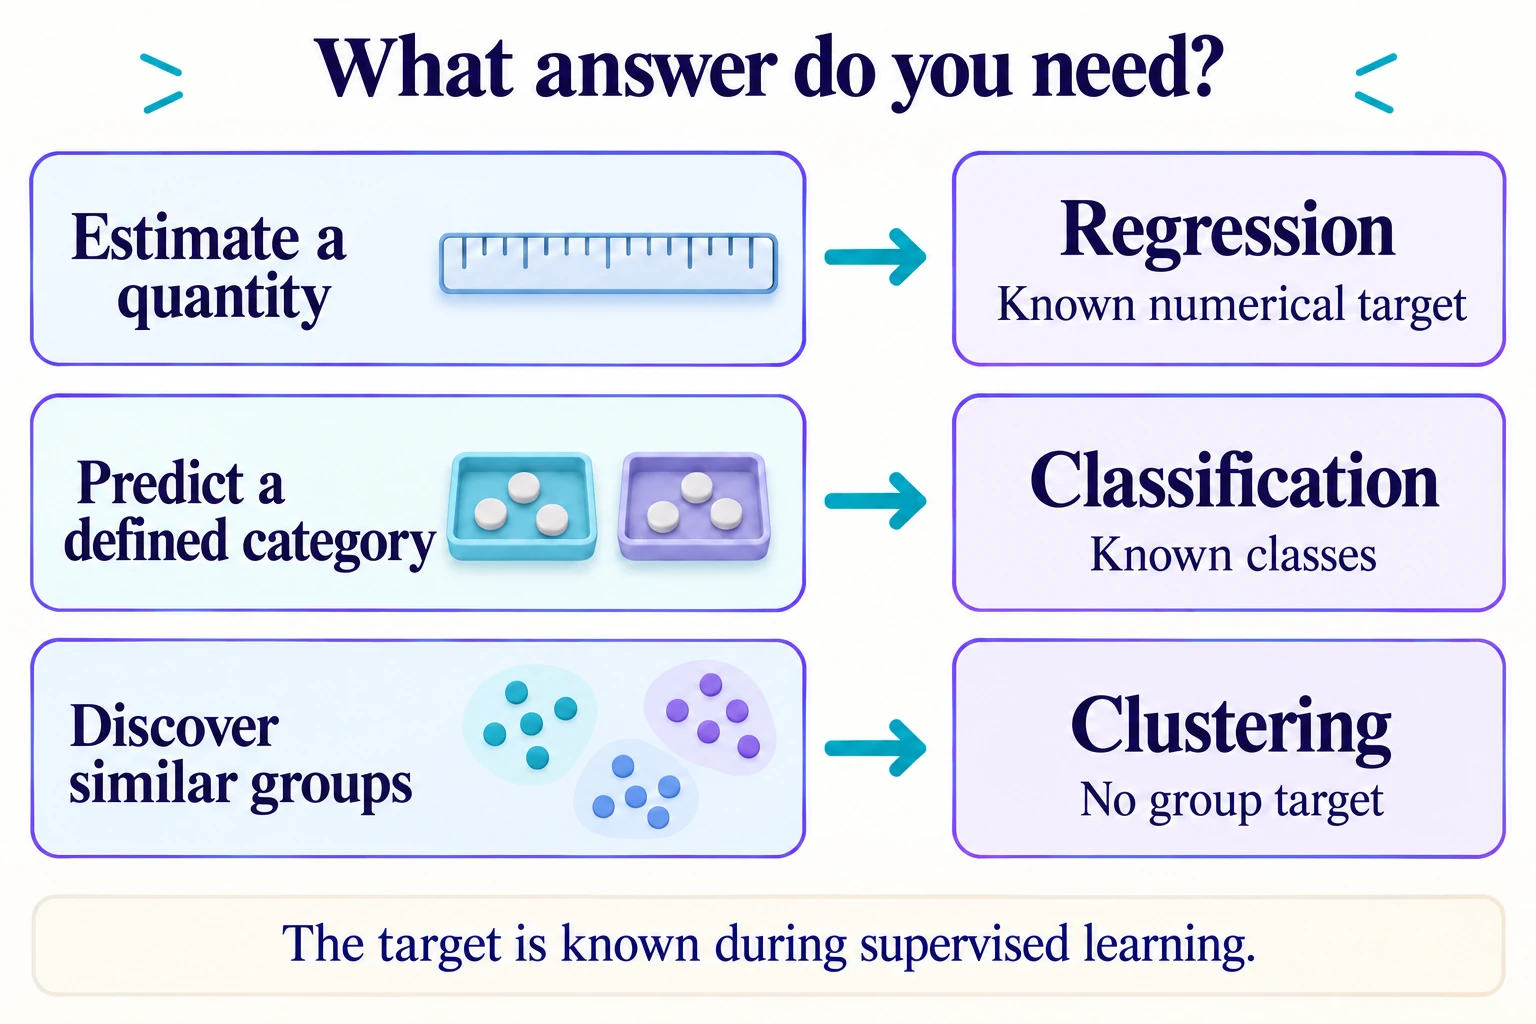
Regression, classification or clustering: to choose between them, start with the answer you need. Do you want to estimate a quantity, predict a category whose meaning is already defined, or find groups of similar observations? These three goals lead to different tasks, even when the initial data concern the same subject.
In the lesson on supervised and unsupervised learning, you explored the role of the target. We will now use this distinction to frame a specific problem: what output to request, what information to provide and what errors to examine. Choosing an algorithm comes next.
Before you begin. An observation is one case described by the data and represented by a row; a variable is one recorded attribute of that case, represented by a column. The examples use fields from the StudentPerformanceFactors.xlsx workbook, prepared from the Student Performance Factors dataset on Kaggle.
Contents
Regression, classification or clustering: three possible answers
A machine learning task describes what the system should learn to produce. ‘Use a decision tree’ does not define the task: this method can estimate a quantity or predict a category. A more useful question is: ‘What should the application display for a new case?’ Google’s problem-framing guide therefore recommends specifying the output before choosing the model.
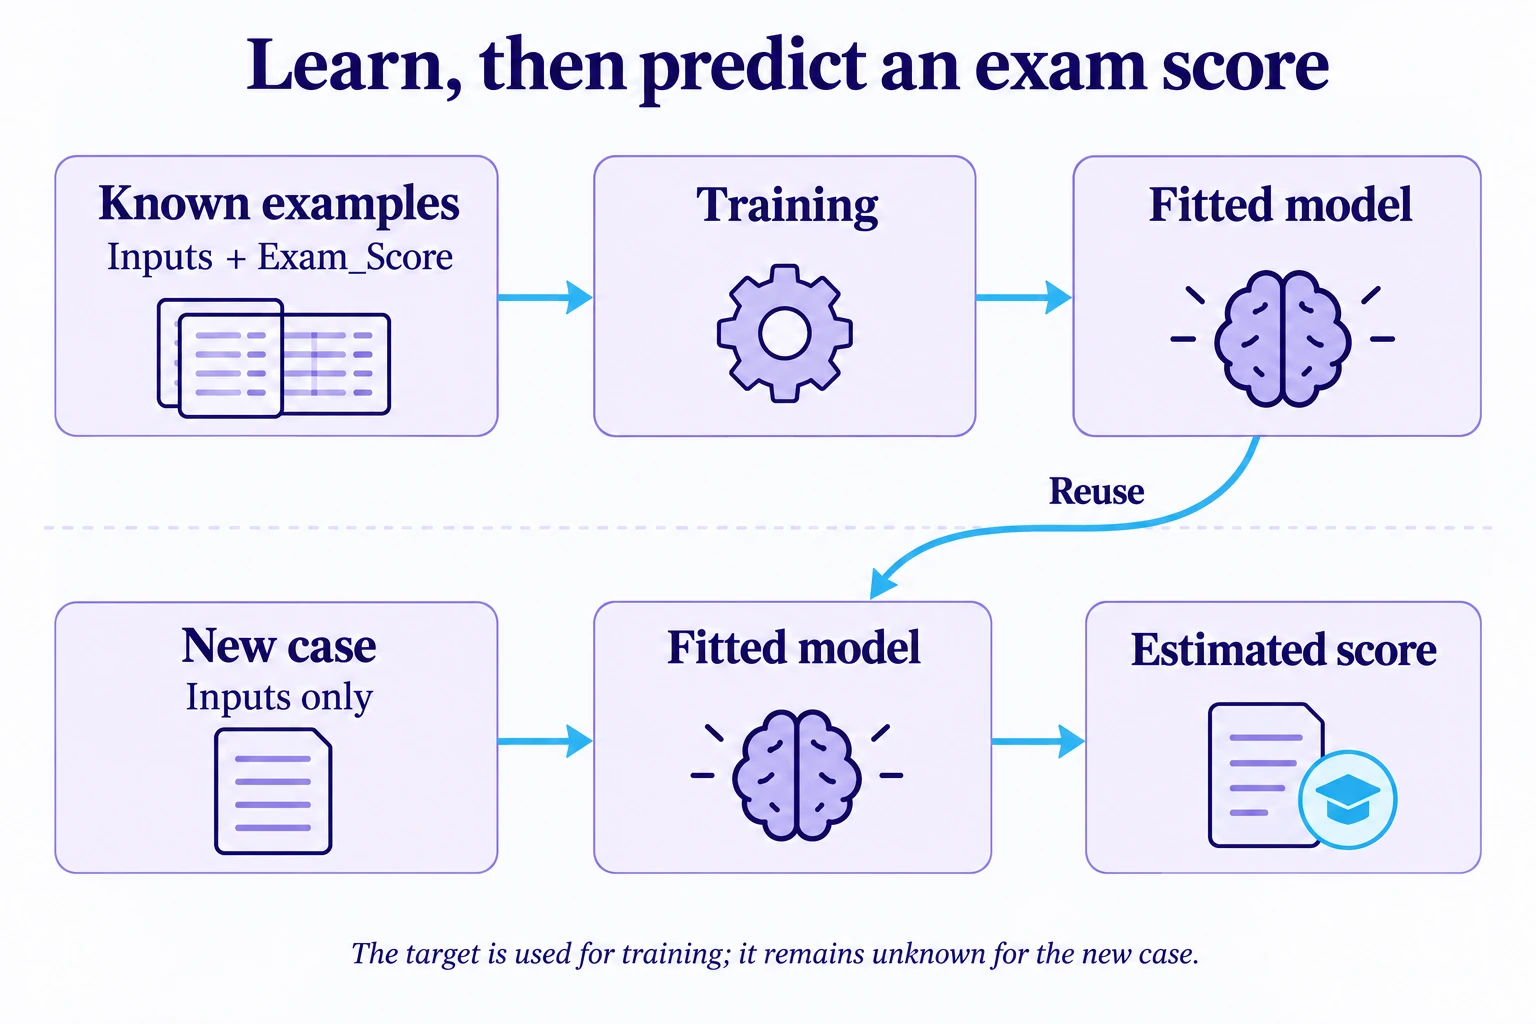
In supervised learning, each training example pairs its input variables with a known answer. This answer is the target, often denoted by y; the inputs are often denoted by X. During training, the model is fitted using both the inputs and their corresponding target values. Fitting means adjusting the model to learn from these known examples. To make a prediction for a new case, only the available inputs are supplied. The target is what the model must estimate, rather than information it receives for that new case. Google’s introduction to supervised learning describes this process.
Regression and classification belong to this supervised setting. The clustering task studied in this lesson is unsupervised: it seeks to organize observations without being given the expected category for each one. There are therefore three tasks, but two learning settings.
Regression: estimating a quantity
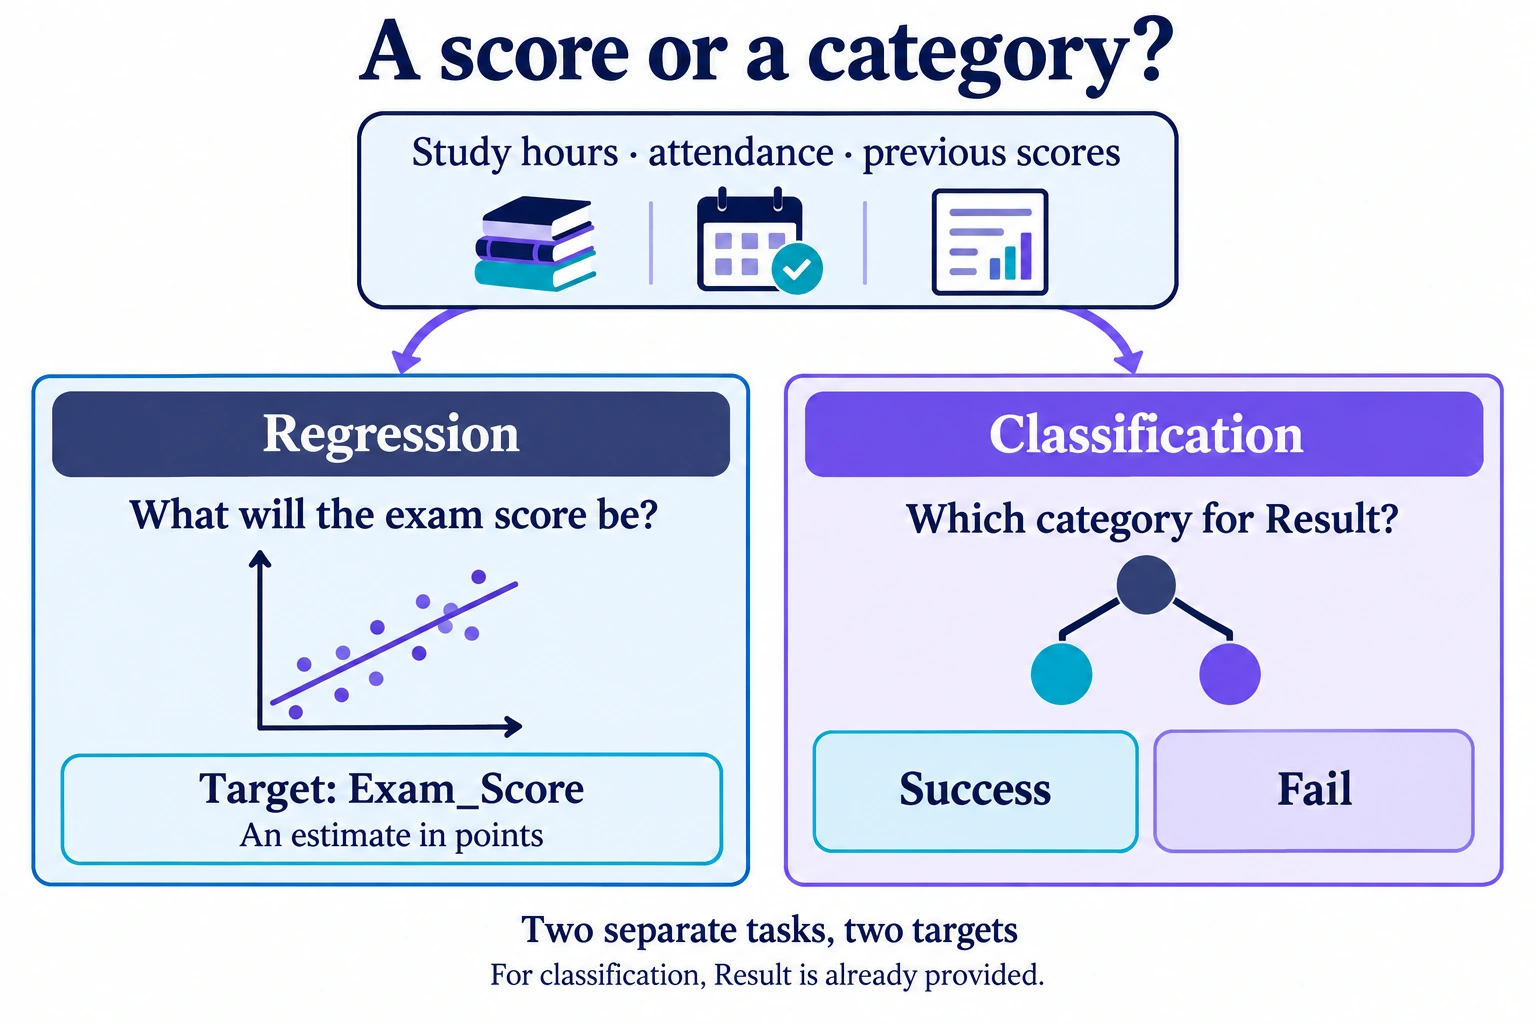
Regression involves learning to estimate a numerical target that represents a quantity. In our regression dataset, the sole target is Exam_Score, the exam score.
Let us frame the request: ‘Using information known before the exam, what score could we estimate?’ Among the possible inputs, Hours_Studied records study hours per week, Attendance the percentage of classes attended and Previous_Scores scores on previous exams. Their presence in the file does not guarantee that they will be useful; it allows us to define an initial problem to investigate.
| Study (hours/week) | Attendance (%) | Previous scores | Exam_Score |
|---|---|---|---|
| 23 | 84 | 73 | 67 |
| 19 | 64 | 59 | 61 |
| 24 | 98 | 91 | 74 |
In the first row, 67 is an observed score, not a prediction. The model would learn from many rows of this kind. Once trained, it could receive the inputs for a new case and produce a numerical estimate. This estimate would need to be evaluated on other observations with known scores that had been set aside for this check.
Storing Exam_Score as integers does not turn this into a classification problem. The aim is to estimate a quantity, and an estimate can include decimal places. Regression is not limited to fitting a straight line either: several families of models can estimate the same numerical target.
Classification: predicting a defined category
Classification involves learning to predict a category, called a class, from those defined for the problem. In a separate classification dataset, the sole target is Result. For each training observation, the recorded label is either Success or Fail. These labels are already supplied: they are read directly as the answers the model must learn to predict.
| Study (hours/week) | Attendance (%) | Previous scores | Result |
|---|---|---|---|
| 23 | 84 | 73 | Success |
| 19 | 64 | 59 | Success |
| 24 | 98 | 91 | Success |
| 13 | 69 | 68 | Fail |
The request becomes: ‘Which value of Result should we predict for a new observation?’ The inputs describe the new case; its category remains to be estimated. This is binary classification because there are two classes. With more than two classes, it is called multiclass classification.
Numerical inputs do not change the task. Study hours and attendance can be used for classification. Similarly, if classes are represented by numerical codes, those codes still identify categories: they do not turn the target into a quantity to estimate.
Some models estimate the probability of belonging to a class. A decision rule then determines which category to predict. The intermediate output is numerical, but it concerns a class: this is still a classification problem. Despite its name, logistic regression is used for this task. An estimated probability must also be evaluated; it does not provide certainty about an individual case.
Clustering: exploring similar observations
Clustering looks for groups of similar observations without being given a target that specifies the expected group for each one. Here, similarity means resemblance based on the features and the way they are compared.
For our data, we might ask: ‘Which observations have similar profiles in terms of study hours, attendance and sleep?’ The analysis would then use Hours_Studied, Attendance and Sleep_Hours, which records hours of sleep per night. The algorithm is not given a correct group label for each observation to learn from. If clusters are formed, they will then be described and interpreted using the features chosen for the analysis.
The word ‘close’ requires a choice. One hour of study and one percentage point of attendance do not have the same unit. For a distance-based method, leaving values unscaled or changing their scale can change which observations are considered neighbors. Preparing data for clustering is therefore part of the reasoning. It must match the question being studied.
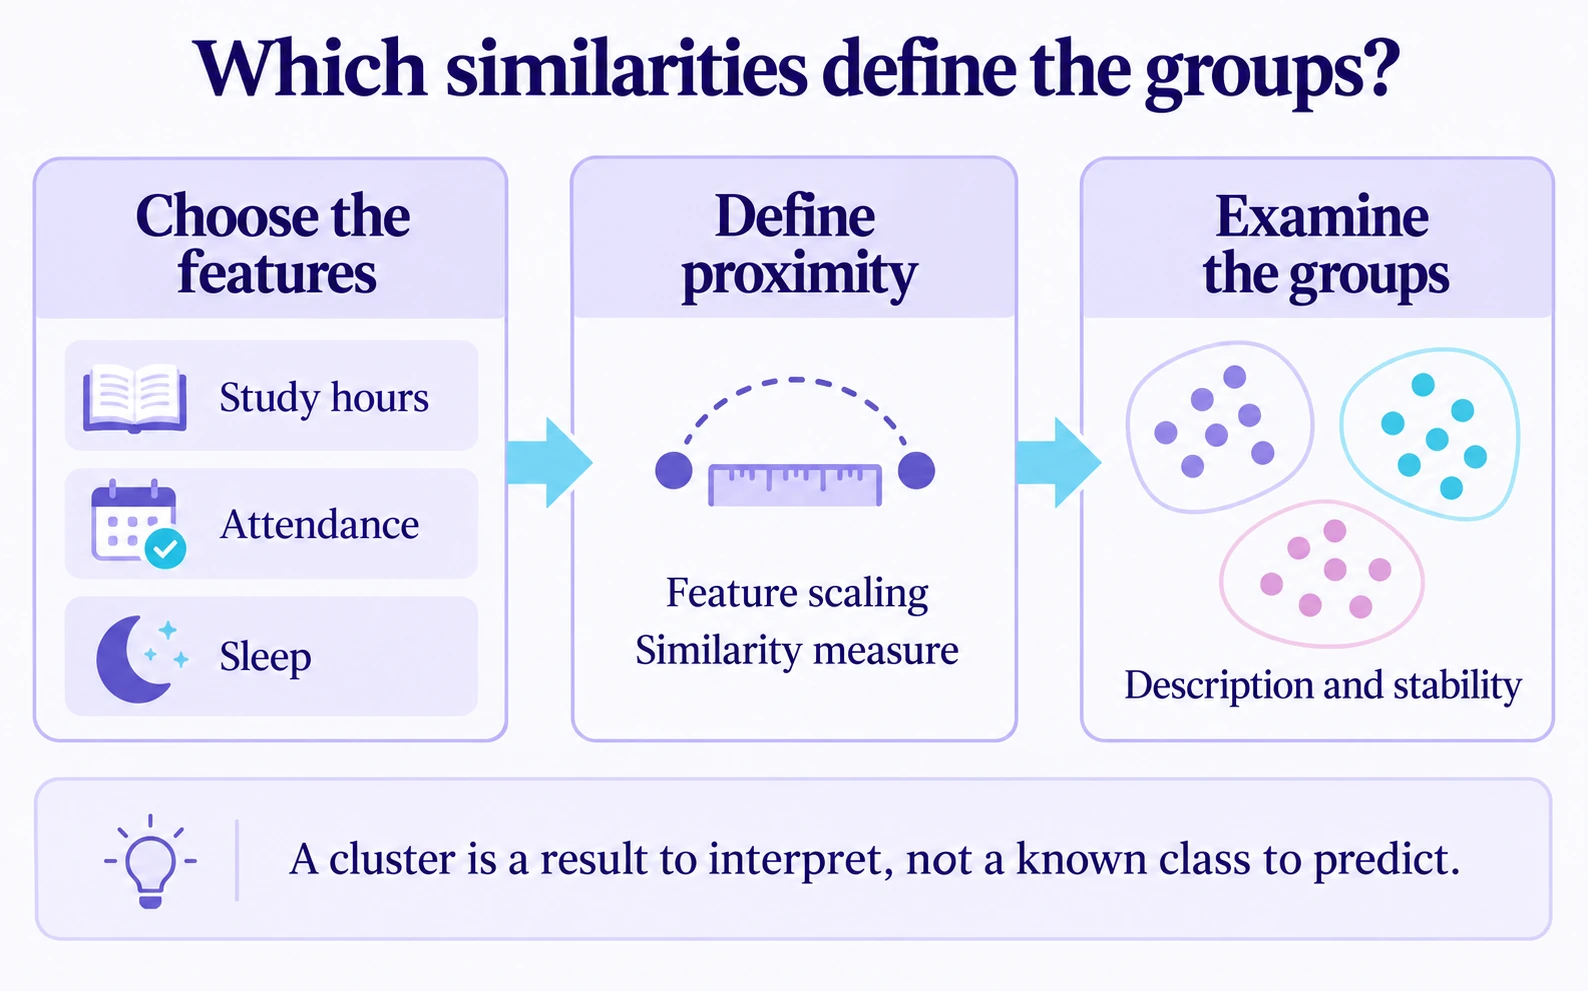
The number of clusters also depends on the method. With k-means, for example, the number of clusters, denoted by k, is chosen in advance. The algorithm then partitions the observations into clusters using a distance-based criterion. Requesting three clusters does not prove that there are three natural categories of students: that number is a choice made before the algorithm runs, rather than a finding established by the data.
A cluster number simply identifies a group. Cluster 2 is not better than cluster 1. Groups formed from study habits are not enough to draw conclusions about academic success or prescribe an intervention. Before interpreting the result, examine the clusters’ features and their stability when the analysis changes.
Choosing the task in five questions
To choose between regression, classification or clustering, write a short brief before looking for an algorithm. It should allow another person to understand what the system will produce and why the available data are suitable for that need.
- What answer would be useful? Write down what the application should display: an estimate in points, one of the categories recorded in
Result, or a description of the groups found. - Does the output describe a quantity, a defined class or groups to discover? Examine its meaning, not just its data type. An integer can measure a quantity or serve as a class code.
- What historical answers are available? For the supervised tasks presented here, training examples must contain the corresponding target. To explore similarities, specify the features to compare instead.
- When must the answer be produced? The inputs must be available at that point. Attendance calculated over an entire period may not be suitable for a prediction made at the start of that period.
- How will you recognize a useful result? Specify which errors matter and how you plan to check them. An error in points, an incorrect category and a group that is difficult to interpret require different checks.
In the application project, the desired answer is an estimated score. The chosen task is therefore regression with Exam_Score as the sole target. The model and its settings still need to be chosen. The classification dataset and the exploration of profiles remain two separate problems, with their own goals.
Planning an evaluation suited to the task
A metric is a measure that summarizes one aspect of a result. It is chosen according to the task and intended use. Choosing the task therefore helps determine how to evaluate it; this choice alone does not guarantee useful predictions.
- For regression, examine the errors. Compare estimated values with observed values. Mean absolute error, or MAE, is calculated by taking the absolute difference between the predicted and observed values for each observation, then averaging those differences. For an exam score, the result is expressed in points, on the same scale as the target. It summarizes errors across the evaluated cases; it does not set an upper limit on the error for an individual case.
- For classification, examine category errors. A confusion matrix compares observed classes with predicted classes, showing the number of cases for each combination. It helps reveal which categories are confused with one another. The overall proportion of correct predictions, called accuracy, can hide poor performance on an underrepresented class.
- For clustering, examine the resulting structure. In particular, consider whether members of a cluster are close to one another and whether the clusters are separated, according to the chosen comparison. This evaluation must also consider the meaning and stability of the clusters; it does not automatically provide a proportion of correctly predicted categories.
The classification dataset illustrates why care is needed: reading Result gives 6,539 Success and 68 Fail across 6,607 observations. Always answering Success would give almost 99% correct answers on this dataset while missing every Fail. This calculation describes a constant answer applied to the observed labels; it is not the result of training a model.
For both supervised tasks, evaluation must use cases that were not used to fit the model. Data preparation steps that learn from the data must also be fitted only on the training examples, then applied to the evaluation cases. For example, if a scaling transformation is learned from the data, its settings must come from the training set. The evaluation cases are transformed using those same settings. The scikit-learn documentation describes this problem of data leakage. Comparing a result with a simple baseline then helps assess what the model actually contributes.
Practice: frame the task before choosing a model
For each request, identify the task, the target if there is one, and one precaution. You can answer on paper; no calculations or code are needed.
- An application must estimate an exam score using information available before the exam.
- Another model must predict
SuccessorFailfrom examples in whichResultis already filled in. - An analysis must explore study and sleep profiles without reference groups.
- A team wants to estimate a score but has no historical scores. It proposes replacing the estimate with three groups.
- To predict
Resultfor new cases, someone proposes including its value among the inputs.
View the answers and explanations
1. Regression. The target is Exam_Score. Check that each input will be known when the application produces its estimate, then examine the errors on observations set aside for evaluation.
2. Binary classification. The target is Result, with its supplied labels Success and Fail. Examine errors for both classes, taking their imbalanced counts into account.
3. Clustering. No group target is supplied. Choose the features to compare, then examine the meaning and stability of the resulting clusters. Their numbers do not rank the students.
4. The need is not met. Three groups are not an estimated score. Reconsider the available data or explicitly reformulate the goal, without presenting clustering as an equivalent replacement.
5. Data leakage. Supplying Result would give the model the answer it must predict, which will be unknown for the new case. The target must stay out of the inputs.
Common misconceptions to avoid
Choosing based on the algorithm’s name. Logistic regression is used for classification. A family of models may also offer variants for several tasks. Always check the output that the model learns to produce.
Confusing classification with ranking. Predicting a category does not mean ordering observations from best to worst. Likewise, a cluster identifier does not establish an order of merit.
Treating clusters as a discovered truth. The selected variables, their preparation and the method all contribute to the result. Clustering can help explore data without establishing the existence of natural or stable categories.
Turning a prediction into a causal explanation. Estimating a score from study hours does not demonstrate the effect of increasing those hours. Predicting an answer and establishing a cause require different approaches.
Key takeaways
Choosing between regression, classification or clustering means specifying the answer you need: a quantity, a defined category or groups to explore. Then check that the data can address that need and that the evaluation matches the intended use. Framing the problem remains necessary whichever algorithm you choose.
Sources and further reading
- Gareth James, Daniela Witten, Trevor Hastie, Robert Tibshirani and Jonathan Taylor, An Introduction to Statistical Learning, with Applications in Python, 2023: §§ 2.1.4–2.1.5, pp. 25–27, on the tasks; § 12.4, pp. 520–521, and § 12.4.3, pp. 532–535, on clustering and its limitations.
- Aurélien Géron, Hands-On Machine Learning with Scikit-Learn and PyTorch, first edition, version dated October 22, 2025: Chapter 1, pp. 10–12, on supervised and unsupervised tasks; Chapter 8, on clustering.
- Google for Developers: framing a machine learning problem and preparing data for clustering.
- scikit-learn: evaluating models, evaluating clustering and avoiding data leakage.
- Lai Ng., Student Performance Factors, Kaggle. The examples and counts were checked against the local
StudentPerformanceFactors.xlsxworkbook.
